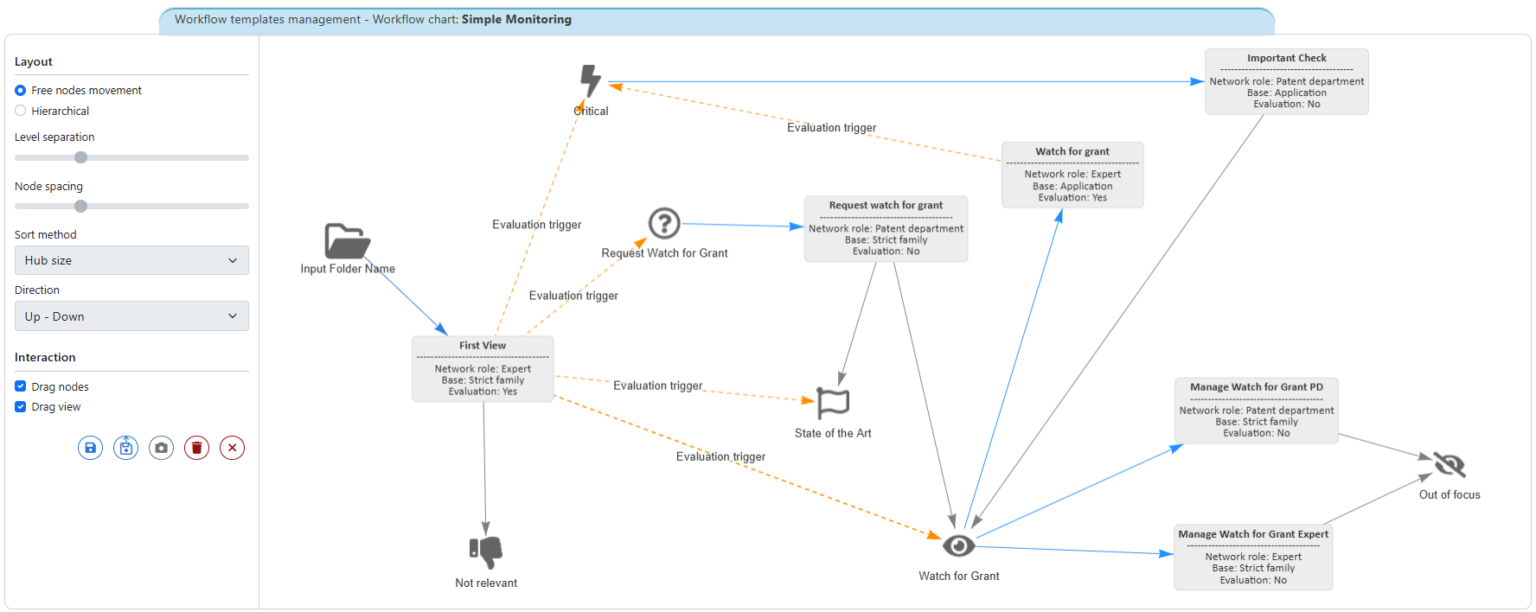
It is now possible to graphically display created processes in the new workflow concept. This visual component allows users to view processes clearly and intuitively understand individual workflows.
This is how you access the graphical display:

The graphical view makes it easier to understand the process structures and provides an excellent basis for discussions and coordination within the team. Changes in the processes can be checked directly using this visualization and their effects are immediately visible.

Use the graphical representation to design your work processes efficiently and quickly identify optimization potential. This new function represents a further step in our efforts to provide you with advanced functions that facilitate the planning and implementation of your projects.


